Tutorial - worker application
How to build, step by step, a worker application with Yokai.
Overview
In this tutorial, we will create a worker application subscribing to Pub/Sub.
You can find a complete implementation in the worker demo application.
Application setup
In this tutorial, we will create our application in the github.com/foo/bar example repository.
Repository creation
To create your github.com/foo/bar repository, you can use
the worker application template.
It provides:
- a ready to extend Yokai application, with the worker module installed
- a ready to use dev environment, based on Air (for live reloading)
- a ready to use Dockerfile for production
- some examples of worker and test to get started
Repository content
Once your repository is created, you should have the following the content:
cmd/: entry pointsconfigs/: configuration filesinternal/:worker/: worker and test examplesbootstrap.go: bootstrapregister.go: dependencies registration
And a Makefile:
make up     # start the docker compose stack
make down   # stop the docker compose stack
make logs   # stream the docker compose stack logs
make fresh  # refresh the docker compose stack
make test   # run tests
make lint   # run linter
Discovery
You can start your application by running:
After a short time, the application will expose the application core dashboard on http://localhost:8081.
Example worker
When you use the template, an example worker is provided.
It logs periodically the message running, and the interval can be configured in configs/config.yaml:
You can run make logs to see it in action:
INF running module=worker service=worker-app worker=example-worker workerExecutionID=346775a2-6be5-43c3-907f-100a986cb2dc
To ease development, Air is watching any changes you perform on Go code
or config files to perform hot reload.
Let's change:
- the application name to
pubsub-workerinapp.name - the worker interval to
1inconfig.example-worker.interval
You can observe the logs again with make logs to see the changes hot reloaded.
Core dashboard
Yokai is providing a core dashboard on http://localhost:8081:


From there, you can get:
- an overview of your application
- information and tooling about your application: build, config, metrics, pprof, etc.
- access to the configured health check endpoints
- access to the loaded modules information (when exposed)
Here we can see for example the worker information in the Modules section:
- active workers
- their events
- and their status
See Yokai's core documentation for more information.
Implementation
Let's start your application implementation, by:
- adding Pub/Sub support
- implementing a worker to subscribe to Pub/Sub
Pub/Sub
Pub/Sub setup
Let's update your docker-compose.yaml to add to your stack:
- a Pub/Sub emulator container
- a Pub/Sub UI container, working with the emulator
services:
  pubsub-worker:
    build:
      dockerfile: dev.Dockerfile
      context: .
    networks:
      - pubsub-worker-network
    ports:
      - "8081:8081"
    expose:
      - "8081"
    volumes:
      - .:/app
    env_file:
      - .env

  pubsub-worker-pubsub:
    container_name: pubsub-worker-pubsub
    image: messagebird/gcloud-pubsub-emulator:latest
    networks:
      - pubsub-worker-network
    ports:
      - "8681:8681"
    env_file:
      - .env
    environment:
      - PUBSUB_PROJECT1=${PUBSUB_PROJECT_ID:-demo-project},${PUBSUB_TOPIC_ID:-demo-topic}:${PUBSUB_SUBSCRIPTION_ID:-demo-subscription}

  pubsub-worker-pubsub-ui:
    container_name: pubsub-worker-pubsub-ui
    image: echocode/gcp-pubsub-emulator-ui:latest
    networks:
      - pubsub-worker-network
    ports:
      - "8680:8680"
    expose:
      - "8680"
    env_file:
      - .env
    environment:
      - PUBSUB_EMULATOR_HOST=${PUBSUB_EMULATOR_HOST:-pubsub-worker-pubsub:8681}
      - GCP_PROJECT_IDS=${PUBSUB_PROJECT_ID:-demo-project}

networks:
  pubsub-worker-network:
    driver: bridge
And the configuration in your .env file:
APP_ENV=dev
APP_DEBUG=true
PUBSUB_PROJECT_ID=demo-project
PUBSUB_TOPIC_ID=demo-topic
PUBSUB_SUBSCRIPTION_ID=demo-subscription
PUBSUB_EMULATOR_HOST=pubsub-worker-pubsub:8681
You can then refresh your stack to bring this up:
This will start the Pub/Sub emulator, with:
- the
demo-projectproject ID - auto creation of the
demo-topictopic - auto creation of the
demo-subscriptionsubscription
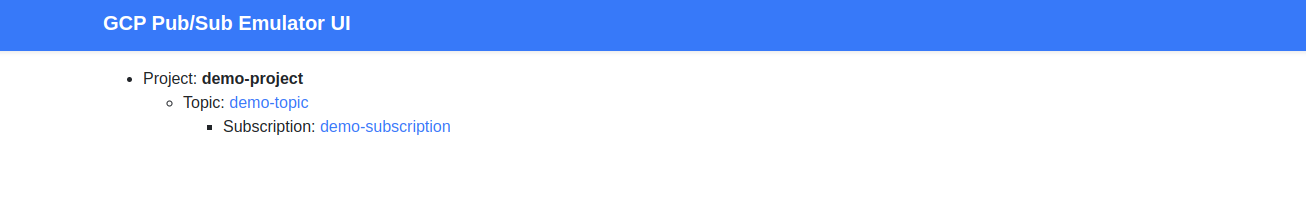
You can check that everything is set up by accessing the Pub/Sub UI on http://localhost:8680:
Pub/Sub module
Yokai's contrib modules repository provides a fxgcppubsub module, offering a *pubsub.Client.
You just need to install it:
And activate it in your application bootstrapper:
package internal

import (
    "github.com/ankorstore/yokai/fxcore"
    "github.com/ankorstore/yokai-contrib/fxgcppubsub"
)

// ...

var Bootstrapper = fxcore.NewBootstrapper().WithOptions(
    // modules registration
    fxgcppubsub.FxGcpPubSubModule,
    // ...
)
You can then provide the module configuration:
modules:
  gcppubsub:
    project:
      id: demo-project
    healthcheck:
      subscriptions:
        - demo-subscription
config:
  topic:
    id: demo-topic
  subscription:
    id: demo-subscription
You can check the fxgcppubsub module documentation to get more details about the available configuration.
Health check
Yokai's health check module allows the core HTTP server to expose health check endpoints, useful if your application runs on Kubernetes. It will execute the registered probes.
The fxgcppubsub module provides a ready to use GcpPubSubSubscriptionsProbe, that will check if a configured subscription is reachable.
To register it, you can use the fxhealthcheck.AsCheckerProbe() function in internal/register.go:
package internal

import (
    "github.com/ankorstore/yokai-contrib/fxgcppubsub/healthcheck"
    "github.com/ankorstore/yokai/fxhealthcheck"
    "go.uber.org/fx"
)

func Register() fx.Option {
    return fx.Options(
        // Pub/Sub subscription probe
        fxhealthcheck.AsCheckerProbe(healthcheck.NewGcpPubSubSubscriptionsProbe),
        // ...
    )
}
This will register the ORM probe for startup, liveness and readiness checks.
You can check that it's properly activated on the core dashboard:


Worker
We can create a SubscribeWorker to subscribe to the demo-subscription subscription:
package worker

import (
    "context"

    "cloud.google.com/go/pubsub"
    "github.com/ankorstore/yokai/config"
    "github.com/ankorstore/yokai/log"
)

type SubscribeWorker struct {
    config *config.Config
    client *pubsub.Client
}

func NewSubscribeWorker(config *config.Config, client *pubsub.Client) *SubscribeWorker {
    return &SubscribeWorker{
        config: config,
        client: client,
    }
}

func (w *SubscribeWorker) Name() string {
    return "subscribe-worker"
}

func (w *SubscribeWorker) Run(ctx context.Context) error {
    subscription := w.client.Subscription(w.config.GetString("config.subscription.id"))

    return subscription.Receive(ctx, func(c context.Context, msg *pubsub.Message) {
        log.CtxLogger(c).Info().Msgf(
            "received message: id=%v, data=%v",
            msg.ID,
            string(msg.Data),
        )

        msg.Ack()
    })
}
We then need to register the worker in internal/register.go with fxworker.AsWorker():
package internal

import (
    "github.com/ankorstore/yokai/fxworker"
    "github.com/foo/bar/internal/worker"
    "go.uber.org/fx"
)

func Register() fx.Option {
    return fx.Options(
        // Pub/Sub worker
        fxworker.AsWorker(worker.NewSubscribeWorker),
        // ...
    )
}
This will:
- automatically inject the
*config.Configand the*pubsub.Clientin theSubscribeWorkerconstructor - and make the
SubscribeWorkerregistered in the worker module's workers pool
Publication
Let's first refresh your stack by running make fresh.
You can check in your application core dashboard that the worker is properly running:


You can open your browser on http://localhost:8680/project/demo-project/topic/demo-topic:

And use the Pub/Sub UI to publish a test message.
You can check your application logs with make logs, and you should see the worker in action:
INF received message: id=1, data=test message module=worker service=pubsub-worker worker=subscribe-worker
Observability
At this stage, your application is able to subscribe to Pub/Sub.
To provide a better understanding of what is happening at runtime, let's instrument it with:
- logs
- traces
- metrics
Logging
With Yokai, logging is contextual.
This means that you should propagate the context and retrieve
the logger from it in order to produce correlated logs.
The worker module automatically injects a logger in the context provided to workers.
Let's add more logs to our SubscribeWorker with log.CtxLogger():
package worker

import (
    "context"

    "cloud.google.com/go/pubsub"
    "github.com/ankorstore/yokai/config"
    "github.com/ankorstore/yokai/log"
)

type SubscribeWorker struct {
    config *config.Config
    client *pubsub.Client
}

func NewSubscribeWorker(config *config.Config, client *pubsub.Client) *SubscribeWorker {
    return &SubscribeWorker{
        config: config,
        client: client,
    }
}

func (w *SubscribeWorker) Name() string {
    return "subscribe-worker"
}

func (w *SubscribeWorker) Run(ctx context.Context) error {
    subscription := w.client.Subscription(w.config.GetString("config.subscription.id"))

    return subscription.Receive(ctx, func(c context.Context, msg *pubsub.Message) {
        logger := log.CtxLogger(c)

        logger.Info().Msgf("in %s", w.Name())

        logger.Info().Msgf(
            "received message: id=%v, data=%v",
            msg.ID,
            string(msg.Data),
        )

        msg.Ack()
    })
}
If you publish another message while observing the logs with make logs, you should see:
INF in subscribe-worker module=worker service=pubsub-worker worker=subscribe-worker workerExecutionID=fd2fd994-bc7a-4715-9d12-0b8075acb74a
INF received message: id=2, data=test message module=worker service=pubsub-worker worker=subscribe-worker workerExecutionID=fd2fd994-bc7a-4715-9d12-0b8075acb74a
You can see that:
- logs are automatically extended with the
workerfield, to know which worker produced them - logs are automatically correlated by
workerExecutionID, allowing you to understand what happened in a specific worker execution
You can get more information about workers logging in the worker documentation.
Tracing
With Yokai, tracing is contextual.
This means that you should propagate the context and retrieve
the tracer provider from it in order to produce correlated trace spans.
The worker module automatically injects the tracer provider in the context provided to workers.
First let's activate the trace module exporter to stdout:
Let's then add trace spans to our SubscribeWorker with trace.CtxTracerProvider():
package worker

import (
    "context"
    "fmt"

    "cloud.google.com/go/pubsub"
    "github.com/ankorstore/yokai/config"
    "github.com/ankorstore/yokai/log"
    "github.com/ankorstore/yokai/trace"
)

type SubscribeWorker struct {
    config *config.Config
    client *pubsub.Client
}

func NewSubscribeWorker(config *config.Config, client *pubsub.Client) *SubscribeWorker {
    return &SubscribeWorker{
        config: config,
        client: client,
    }
}

func (w *SubscribeWorker) Name() string {
    return "subscribe-worker"
}

func (w *SubscribeWorker) Run(ctx context.Context) error {
    subscription := w.client.Subscription(w.config.GetString("config.subscription.id"))

    return subscription.Receive(ctx, func(c context.Context, msg *pubsub.Message) {
        c, span := trace.CtxTracerProvider(c).Tracer(w.Name()).Start(c, fmt.Sprintf("%s span", w.Name()))
        defer span.End()

        logger := log.CtxLogger(c)

        logger.Info().Msgf("in %s", w.Name())

        logger.Info().Msgf(
            "received message: id=%v, data=%v",
            msg.ID,
            string(msg.Data),
        )

        msg.Ack()
    })
}
If you publish another message while observing the logs with make logs, you should see:
// logs
INF received message: id=3, data=test message module=worker service=pubsub-worker spanID=0fa9c8043ea50abe traceID=6be5177482b1386fefe40ef756ee61fa worker=subscribe-worker workerExecutionID=9be1a627-ecc5-4626-b0a5-891ab86b4de7
INF in subscribe-worker module=worker service=pubsub-worker spanID=0fa9c8043ea50abe traceID=6be5177482b1386fefe40ef756ee61fa worker=subscribe-worker workerExecutionID=9be1a627-ecc5-4626-b0a5-891ab86b4de7

// trace span
{"Name":"subscribe-worker span","SpanContext":{"TraceID":"6be5177482b1386fefe40ef756ee61fa","SpanID":"0fa9c8043ea50abe","TraceFlags":"01","TraceState":"","Remote":false},"Parent":{"TraceID":"00000000000000000000000000000000","SpanID":"0000000000000000","TraceFlags":"00","TraceState":"","Remote":false},"SpanKind":1,"StartTime":"2024-02-08T10:46:14.807695672Z","EndTime":"2024-02-08T10:46:14.807857105Z","Attributes":[{"Key":"Worker","Value":{"Type":"STRING","Value":"subscribe-worker"}},{"Key":"WorkerExecutionID","Value":{"Type":"STRING","Value":"9be1a627-ecc5-4626-b0a5-891ab86b4de7"}}],"Events":null,"Links":null,"Status":{"Code":"Unset","Description":""},"DroppedAttributes":0,"DroppedEvents":0,"DroppedLinks":0,"ChildSpanCount":0,"Resource":[{"Key":"service.name","Value":{"Type":"STRING","Value":"pubsub-worker"}}],"InstrumentationLibrary":{"Name":"subscribe-worker","Version":"","SchemaURL":""}}
Here, we can see on logs side, that:
- they are still correlated by
workerExecutionID - but they also have the
traceIDandspanIDfields, correlating logs and trace spans
And on trace span side, that:
- it is correlated by
TraceID - it contains the
Workerattribute matching the worker name - it contains the
WorkerExecutionIDattribute matching the logsworkerExecutionID
You can get more information about workers tracing in the worker documentation.
Metrics
Yokai's metrics module is collecting and exposing automatically metrics.
The core HTTP server of your application will expose them by default on http://localhost:8081/metrics, but you can also see them on your core dashboard:


You can see that, by default, the worker module automatically collects execution metrics on your workers.
Let's now add an example custom metric in our SubscribeWorker to count the number of received messages:
package worker

import (
    "context"
    "fmt"

    "cloud.google.com/go/pubsub"
    "github.com/ankorstore/yokai/config"
    "github.com/ankorstore/yokai/log"
    "github.com/ankorstore/yokai/trace"
    "github.com/prometheus/client_golang/prometheus"
)

var SubscribeCounter = prometheus.NewCounter(prometheus.CounterOpts{
    Name: "messages_received_total",
    Help: "Total number of received messages",
})

type SubscribeWorker struct {
    config *config.Config
    client *pubsub.Client
}

func NewSubscribeWorker(config *config.Config, client *pubsub.Client) *SubscribeWorker {
    return &SubscribeWorker{
        config: config,
        client: client,
    }
}

func (w *SubscribeWorker) Name() string {
    return "subscribe-worker"
}

func (w *SubscribeWorker) Run(ctx context.Context) error {
    subscription := w.client.Subscription(w.config.GetString("config.subscription.id"))

    return subscription.Receive(ctx, func(c context.Context, msg *pubsub.Message) {
        c, span := trace.CtxTracerProvider(c).Tracer(w.Name()).Start(c, fmt.Sprintf("%s span", w.Name()))
        defer span.End()

        logger := log.CtxLogger(c)

        logger.Info().Msgf("in %s", w.Name())

        logger.Info().Msgf(
            "received message: id=%v, data=%v",
            msg.ID,
            string(msg.Data),
        )

        msg.Ack()

        SubscribeCounter.Inc()
    })
}
To collect this metric, we need to register it with fxmetrics.AsMetricsCollector() in internal/register.go:
package internal

import (
    "github.com/ankorstore/yokai/fxmetrics"
    "github.com/ankorstore/yokai/fxworker"
    "github.com/foo/bar/internal/worker"
    "go.uber.org/fx"
)

func Register() fx.Option {
    return fx.Options(
        // metrics
        fxmetrics.AsMetricsCollector(worker.SubscribeCounter),
        // ...
    )
}
If you publish another message, you can then check the metrics on the core metrics endpoint:
# ...
# HELP messages_received_total Total number of received messages
# TYPE messages_received_total counter
messages_received_total 1
Testing
At this stage, we are able to subscribe to Pub/Sub, and we have observability signals to monitor this.
The next step is to provide tests for your application, to ensure it's behaving as expected.
Configuration
Yokai's bootstrapper provides a RunTest() function to start your application
in test mode.
This will automatically set the env var APP_ENV=test, and
will load your test configuration.
For our tests, we can configure:
- the log module to send logs to a
test buffer - the trace module to send trace spans to a
test exporter - the fxgcppubsub module test
project,topicandsubscriptionto use
Let's set the testing configuration in config/config.test.yaml and activate the debug:
app:
  debug: true
modules:
  gcppubsub:
    project:
      id: test-project
    healthcheck:
      subscriptions:
        - tes-subscription
config:
  topic:
    id: test-topic
  subscription:
    id: test-subscription
Implementation
We can now provide functional tests for your worker.
Let's create our TestSubscribeWorker test in the worker_test package:
package worker_test

import (
    "context"
    "fmt"
    "strings"
    "testing"
    "time"

    "cloud.google.com/go/pubsub"
    "github.com/ankorstore/yokai/config"
    "github.com/ankorstore/yokai/log/logtest"
    "github.com/ankorstore/yokai/trace/tracetest"
    "github.com/foo/bar/internal"
    "github.com/prometheus/client_golang/prometheus"
    "github.com/prometheus/client_golang/prometheus/testutil"
    "github.com/stretchr/testify/assert"
    "go.opentelemetry.io/otel/attribute"
    "go.uber.org/fx"
)

func TestSubscribeWorker(t *testing.T) {
    ctx := context.Background()

    // env vars
    t.Setenv("APP_CONFIG_PATH", fmt.Sprintf("%s/configs", internal.RootDir))

    var client *pubsub.Client
    var logBuffer logtest.TestLogBuffer
    var traceExporter tracetest.TestTraceExporter
    var metricsRegistry *prometheus.Registry

    // bootstrap test app
    app := internal.Bootstrapper.BootstrapTestApp(
        t,
        fx.Invoke(func(config *config.Config, client *pubsub.Client) error {
            // prepare test topic
            topicName := config.GetString("config.topic.id")
            subscriptionName := config.GetString("config.subscription.id")

            topic, err := client.CreateTopic(ctx, topicName)
            if err != nil {
                return fmt.Errorf("cannot create test topic %s: %w", topicName, err)
            }

            // prepare test subscription
            _, err = client.CreateSubscription(ctx, subscriptionName, pubsub.SubscriptionConfig{
                Topic:       topic,
                AckDeadline: 10 * time.Second,
            })
            if err != nil {
                return fmt.Errorf("cannot create test subscription %s: %w", subscriptionName, err)
            }

            return nil
        }),
        fx.Populate(
            &client,
            &logBuffer,
            &traceExporter,
            &metricsRegistry,
        ),
    )

    // start test app
    app.RequireStart()

    // publish test message
    testMessage := "test message"

    result := client.Topic("test-topic").Publish(ctx, &pubsub.Message{
        Data: []byte(testMessage),
    })

    id, err := result.Get(ctx)
    assert.NoError(t, err)

    // stop test app (after 100 ms wait to avoid test flakiness)
    time.Sleep(100 * time.Millisecond)

    app.RequireStop()

    // logs assertion
    logtest.AssertHasLogRecord(t, logBuffer, map[string]interface{}{
        "level":   "info",
        "service": "pubsub-worker",
        "module":  "worker",
        "worker":  "subscribe-worker",
        "message": fmt.Sprintf("received message: id=%v, data=%s", id, testMessage),
    })

    // trace assertion
    tracetest.AssertHasTraceSpan(
        t,
        traceExporter,
        "subscribe-worker span",
        attribute.String("Worker", "subscribe-worker"),
    )

    // metrics assertion
    expectedMetric := `
        # HELP messages_received_total Total number of received messages
        # TYPE messages_received_total counter
        messages_received_total 1
    `

    err = testutil.GatherAndCompare(
        metricsRegistry,
        strings.NewReader(expectedMetric),
        "messages_received_total",
    )
    assert.NoError(t, err)
}
In this functional test:
- we start the application in test mode
- we create the Pub/Sub test topic and subscription
- we use the Pub/Sub client to publish a message on the test server
- we assert on the worker logs to ensure it got the message
- we assert on the observability signals (logs, traces and metrics)
You can then run make test:
This tutorial will only cover testing of the SubscribeWorker as example, you need to provide other functional
tests and the classic unit and integration tests for the rest of your application.
Thanks to Yokai's dependency injection system and testing tools, it's easy to provide mocks as dependencies for your implementations.